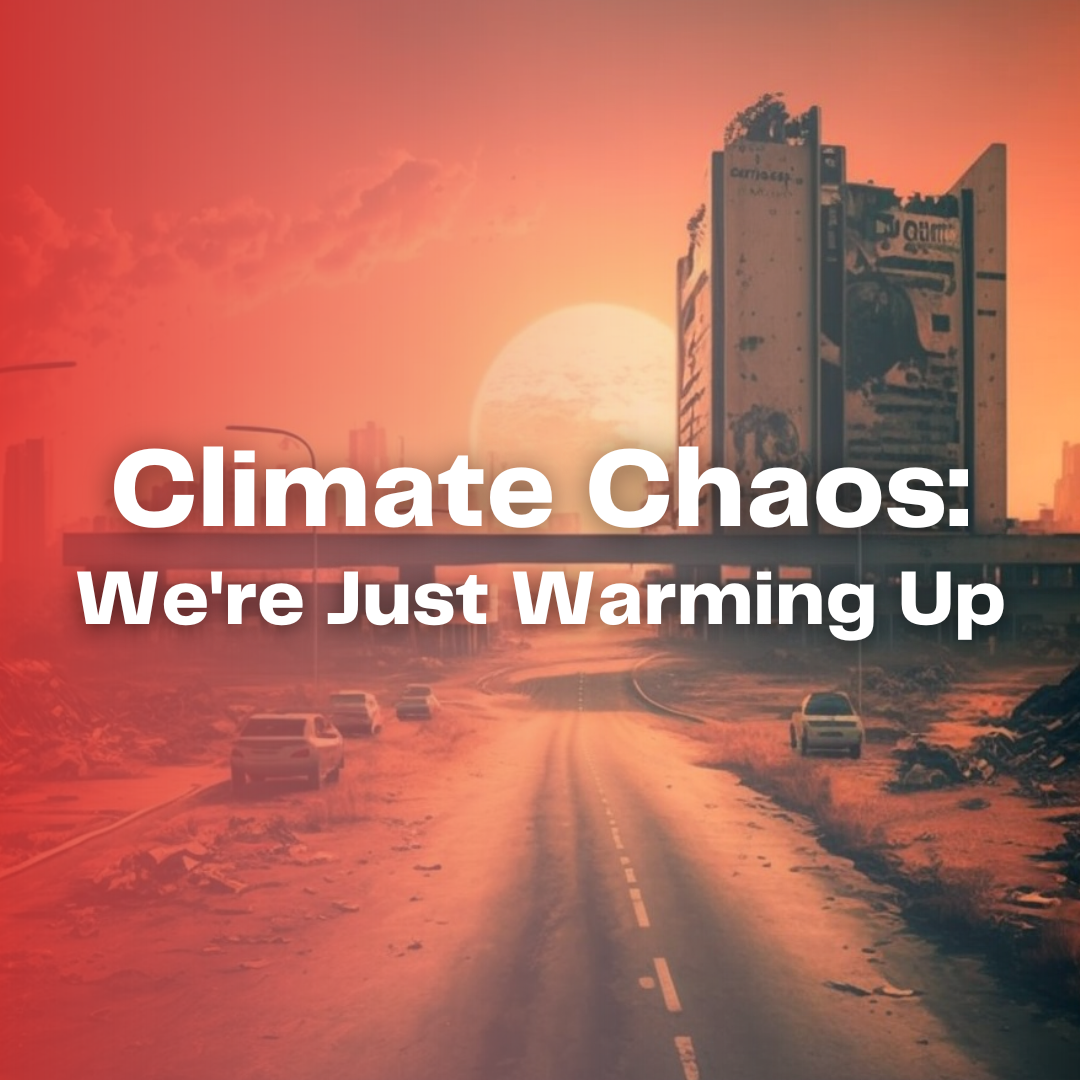
Climate change, or more appropriately, the climate "crisis", looms upon our future and is poised to become one of the most significant challenges our current and future generations will face. This exhibition, titled "Climate Chaos: We’re Just Warming Up", gives you a science informed, starkly visual impression of what this crisis will mean for your lives in urban Indian megacities like Bangalore, Mumbai, Delhi, Chennai and Kolkata.
The exhibition features interactive demonstrations and videos, like showing the link between carbon dioxide emissions and sea-level rise, the increase in frequency of extreme climate events due to a shifting global mean and a live demonstration of the discomfort of humid heat vs dry heat (a particularly coastal problem). The exhibition also features AI-generated speculative imagery of future scenarios of Indian cities, with and without climate intervention. Finally, the exhibition ends with "The Hope", demarcating steps and pointers for individuals, to build up consciousness about the effects of the climate crisis on every aspect of our lives and livelihoods.
As the global average temperature continues to rise at a rate best perceived as "alarming", it becomes ever more important to impart a holistic, science informed awareness which will compel us to act towards mitigating this crisis-in-progress, which will impact all humankind, as well as Nature at large. This exhibition hopes to serve as one such impetus.
Exhibition contents:
-
Guess the Current CO2 Level / How much is too much?
-
Interactive Sea Level Rise Demo with a Video Rendering
-
Extreme Events
-
The Wet-Bulb/Dry-Bulb Conundrum - Live Demonstration
-
PAINTING the Future
-
The Hope
How much is too much? Guess the Current CO2 Level
You might have heard that the amount of CO2 in the atmosphere is much more than it has been in the past 1 million years. Do you have an intuition for how much more it actually is, and how quickly it got to that level? You can test it out in this interactive demonstration “Guess the Current CO2 Level”. This demonstration aims to show you how carbon dioxide levels have fluctuated over time, and how it has skyrocketed in recent years - the effect is almost shocking - leaving little doubt about the severity of this very man-made problem.
We focus on CO2 because the global mean temperature is closely related to iit. You can see that by pressing “T” in the sketch. Thus, as the CO2 skyrockets, so will the global mean temperature, sooner or later. We need to act before that happens.
Furthermore, as you will see, rise in CO2 does not lead to immediate rise in temperature. It requires some time as the effects have to spread through the intermediate factors which control the direct rise in temperature. So, there is still hope. If we can tame our current CO2 level, fast, the temperature will not skyrocket. But that time window for action is quickly closing.

Interactive Video Link:
https://openprocessing.org/sketch/1856743
This demonstration was inspired from the following MIT WebPage:
https://climateprimer.mit.edu/climate-science
Temperature data:
https://www.nature.com/articles/nature19798#MOESM245
Sea the Level Rise: An interactive demo
In the last demonstration, we saw how the global mean temperature is related to the mean CO2 level. This mean temperature controls the Mean Sea Level by melting the ice in glaciers and polar ice caps as well as expanding water thermally.
Thus, CO2 increase will not only increase the temperature but also the Sea Level. The relation between the CO2 and the Sea Level Rise is almost linear. Sea-level rise will be devastating for most landmasses, especially for cities near the sea.
The aim of this activity is to show sea level rise and its implications. The activity is an interactive visualization where you can change the level of CO2 in the atmosphere and observe how much the sea level will rise and how it can impact populated regions.
The size and colour of the hypothetical cities represent its population and population density respectively. As cities (/parts of a city) drown, the population living in the submerged region migrates to other cities. This raises the population density of the remaining cities resulting in poor resource availability, economic instability and class disparity. This animation aims to show that. You can see the delay between increase in CO2 level and rise in Sea Level, they are not instantaneous.

Interactive Video Link:
https://openprocessing.org/sketch/1853396
Data for the animation: The relationship between CO2 and Sea Level Rise is linearly extrapolated from the following data
CO2:
https://climate.nasa.gov/vital-signs/carbon-dioxide
Sea Level Rise:
https://climate.nasa.gov/vital-signs/sea-level
IPCC predicts that by 2100, the Global mean sea level will rise around 1 m compared to the current level, with the worst-case scenario being 2.5 m. However, the mean level is not all. We also need to focus on the fluctuations. This is demonstrated in the next demonstration.

Link to the interactive demonstration. Run the file “sea_level_rise_highres.pde”. You would need Processing to run it.
Interactive website to see how sea level rise will affect different parts of the world in satellite view. This website provides time estimates to reach various sea level heights and flooding risks.
The NASA Sea Level Projection tool (https://sealevel.nasa.gov/ipcc-ar6-sea-level-projection-tool) will help you in understanding the at-risk regions with current predictions.
Extreme Events
Why is the change in the global mean temperature a matter of such concern? After all, a 2 degrees warming, as often discussed in Global Climate Summits, doesn’t “sound” all that bad. The answer lies in what happens to extreme events upon a change in the mean of the distribution, which is something we don’t automatically have an intuition for.
Playing with an interactive Gaussian distribution, you will discover how the frequency of extreme weather events, such as heat waves, will drastically increase as the Earth's temperature continues to rise. This activity will help you appreciate how a seemingly minor change in the “mean” can drastically alter the frequency of extreme events. The same is true for hurricanes, droughts, floods and freezing blizzards!

Interactive Video Link:
https://openprocessing.org/sketch/1861297
Wet-Bulb/Dry-Bulb Conundrum
The temperature we observe in a thermometer or search “today’s temperature” in our mobiles is intuitively called Dry bulb temperature. On the other hand, Wet bulb temperature (WBT) is a measure of how effectively evaporative cooling can lower the body temperature of a person or animal. It is measured using a thermometer wrapped in a wet cloth, which is used to simulate the evaporative cooling effect on the skin.
Climate change will lead to a significant increase in wet bulb temperature in many regions around the world. Wherever there is high humidity, like in coastal regions, WBT rises almost as much as the rise in air temperature. Hence climate change would increase the WBT significantly in very humid parts of the world, making it more difficult for the body to cool down naturally.
In recent years, the concept of critical WBT has gained attention due to the potential danger it poses to human life. Critical WBT is the point at which a healthy person could survive for only six hours, due to inability to cool down adequately. This is usually considered to be 35 0C theoretically, approximately equivalent to an air temperature of 40 0C with a relative humidity of 75%. Practically, critical WBT is closer to 32 0C depending on various activity levels, environments and adaptability. In parts of Chennai, wet bulb temperature already reaches 32 0C once in a while.
Studies suggest that if global temperatures continue to rise at current rates, critical wet bulb temperature could be reached in parts of the world with high humidity levels, making them uninhabitable for humans. This poses a significant threat to public health and highlights the urgent need to take action to address climate change.
The demonstration tries to explain the significance of rising Wet Bulb Temperatures by making the participants experience it. The participant will be told to put their hands inside two boxes, with different WBTs. In one of the boxes WBT shall be closer to the critical WBT. The participants should be able to experience a stark difference in discomfort within a few seconds of putting their hands inside (subject to ambient humidity at the location of experiment).
For a DIY enthusiast, here is a quick look (video 1, video 2) and a brief description of the WBT demonstration setup. There are two DHT22 humidity and temperature sensors kept inside the two glass boxes. We are controlling the humidity of one of the glass boxes (box with critical WBT) with steam generated in a pressure cooker. The flow rate of the steam into the glass box is controlled with a solenoid valve connected with Arduino. The temperatures of both of the boxes are controlled with the attached 200W household bulbs which are connected to a relay module and the Arduino for its automation. Finally, the temperature, humidity and WBT of the respective boxes are displayed on the OLED modules.


Article on impact and importance of increasing Wet Bulb temperature
Study on Critical Wet Bulb Temperature
Wet Bulb Temperature calculator.
Data for Wet Bulb Temperatures and other measures.
PAINTING the Future
Have you ever wondered what the future holds for our Indian megacities, with the impending threat of extreme climate change? In 'PAINTING the Future', we dreamt-up a series of futuristic scenarios using the generative AI tool Midjourney, showcasing the potential impact of climate change on our beloved cities, both with and without immediate intervention on our part.
From Bangalore to Mumbai, Delhi to Chennai, these images offer a sobering glimpse into what could happen if we fail to take action now, while at the same time leaving us with hopeful future homes if we collectively work on mitigating disaster. These images are of course not “scientifically accurate”, but highly impressionistic, though made with a general sense of the expected outcome of extreme climate change in India.
As people walk around the venue, they can dip into these thought-provoking images. The exhibit also demonstrates the increasing artistic capabilities of AI in helping envision unseen scenarios.
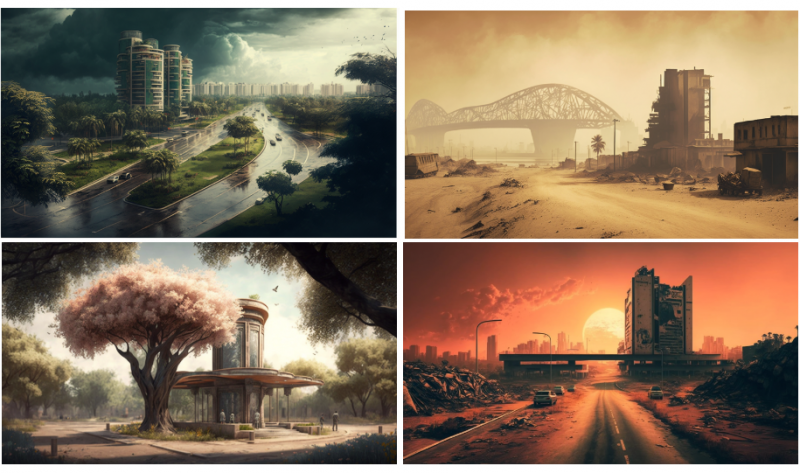
Image Gallery:
https://drive.google.com/drive/folders/1zejZ7aJbI78qA3WAH_ejI14BIRmrvWx4?usp=sharing
The Hope
Hope is not a strategy, but a necessary ingredient while facing any disaster. In this current age of short-term content and its virality, fear is capitalized. Often, people who understand climate change are misdirected to the belief that doom is the end of the planet. This results in a sense of defeat in communities which has stopped them considering the long-term effects of their actions.
Change can happen every day, in increments of reformation of daily life. Humans have always had the solidarity to adapt to adversities in the past. This section of the exhibition will focus on the active steps that can be taken to improvise, adapt and overcome the challenges of the future and add strong emphasis on how the development of science and technology is a crucial, if not a necessary part of the process.
A collection of potential solutions to tackle climate change

Interactive Video Link:
https://public.flourish.studio/visualisation/12985605/
The International Centre for Theoretical Sciences (ICTS) of the Tata Institute of Fundamental Research is organizing this exhibition in collaboration with Science Gallery Bengaluru as a part of its participation in the International Year of Basic Sciences for Sustainable Development (IYBSSD-2022/23). The role of ICTS is to plan and create engagement on climate science, in collaboration with faculty, researchers, students and the outreach team.
Team:
Anugraha A., Ankur Barsode, Anupam Ghosh, Deanish M. A., Harsh Kumar Khatwani, Ikbal Ahmed, Rajarshi Chattopadhyay, Rama Govindarajan, Roshini George, Saumav Kapoor, Siddhartha Mukherjee, Santhiya P.S., Vaishnavi V. G., Vinay Kumar
 icts
icts resin
resin- Other links